 30 Year Home Loan Calculator
This calculator will compute a mortgage's monthly payment amount based on the principal amount borrowed, the length of the loan and the annual interest rate. This calculator will also compute your total mortgage payment which will include your property tax, property insurance and PMI payments. Then, once you have computed the monthly payment, click on the "Create Amortization Schedule" button to create a report you can print out.
For your convenience current Columbus 30-year mortgage rates are published below.
Current Columbus Mortgage Rates
We publish current Columbus mortgage rates. OH homebuyers and refinancers can use the filters at the top of the table to see the monthly payments and rates availble for their loans.
The Complete Guide to 30-Year Fixed Rate Mortgages

Buying a house is a major life event that signifies stability and commitment. You must make monthly payments for years to obtain your home. This is something you should prepare for especially if you’re a first-time homebuyer.
Before you can purchase a house, you must build enough funds, arrange your finances, and get ready with a good credit score. This will help you qualify for a loan and secure a more competitive rate.
Out of all the mortgage options, you’ve probably noticed 30-year fixed rate loans. Many people actually have this type of mortgage. It’s very common, so it seems like a safe option. While many people get 30-year fixed mortgages, it’s worth knowing their benefits and drawbacks. It’s also important to know which lenders offer a deal that will suit your needs.
Read on to learn more about 30-year fixed-rate loans before deciding on a deal.

What is a 30-Year Fixed-Rate Mortgage?
A 30-year mortgage comes with a locked interest rate for the entire life of the loan. Because the rate stays the same, expect your monthly payments to be fixed for 30 years. You can obtain 30-year fixed-rate loans from government-sponsored lenders, private mortgage companies, banks, and credit unions.
Though property insurance and taxes may change, you don’t need to worry about increasing mortgage payments. As long as you don’t miss payments, your loan should be paid off within 30 years. Thirty-year fixed mortgages are widely used as a loan purchase tool. It’s also popular for first-time buyers who are still building their income.
Why Do Buyers Choose 30-Year Fixed-Rate Loans?
Homebuyers choose this type of mortgage because of affordable monthly payments. They are known for much lower monthly payments compared to the following short terms:
Many buyers are attracted to cheap monthly payments. The lower payments also mean you can qualify for a larger loan amount. In general, it is easier to qualify for a 30-year fixed home loan compared to shorter loans. If your finances are tight, in certain cases, this may be the only financing option available to you.
However, it comes with a significant drawback. It only seems affordable when buyers focus on the monthly payments.
Costly Interest Charges
Due to the longer payment duration, interest rates in a 30-year mortgage are often higher. Lenders charge a higher interest rate precisely because payments are spread out for 30 years. And as with any loan, the longer payment period generates much larger interest costs.
Here’s how 30-year fixed-rate loans compare to shorter terms. The table below compares the interest rate (APR), monthly payment, and total interest cost for 15, 20, and 30-year fixed-rate mortgages. Let’s suppose you made a 20 percent down payment and borrowed a $270,000 loan.
Loan Amount: $270,000
| Loan Term | 30-Year FRM | 20-Year FRM | 15-Year FRM |
|---|---|---|---|
| Interest rate (APR) | 3.8% | 3.65% | 3.4% |
| Monthly payment | $1,258.08 | $1,586.78 | $1,916.95 |
| Total interest | $182,910.55 | $110,827.78 | $75,051.19 |
Based on the example above, you’ll immediately notice that monthly payments increase as the term gets shorter. But as the payments get higher, total interest charges are substantially reduced with shorter terms.
With a 30-year fixed-rate loan, your monthly payment is $1,258.08. The 20-year fixed mortgage has a monthly payment of $1,586.78, which is $328.70 more expensive. Likewise, the 15-year fixed mortgage has a higher payment of $1,916.95, which is $658.87 more costly than the 30-year fixed term. Depending on your finances, it’s good to take a shorter loan with payments you can afford.
You’ll pay a total of $182,910.55 in interest costs with a full 30-year fixed mortgage. But if you take a 20-year fixed-rate term, it will be reduced to $110,827.78, which saves $72,082.77 in interest charges. And if you qualify for a 15-year fixed mortgage, the total interest will be $75,051.19. You’ll save a total of $107,859.36 in interest costs compared to a 30-year fixed term. Ultimately, you’ll save more money if you pay off your loan earlier.
The Pros and Cons of a 30-Year Fixed-Rate Home Loan

To better understand the benefits and disadvantages of a 30-year fixed-rate loan, below is a table showing its pros and cons. Taken side by side, it should help you decide if this type of loan is right for you:
| Pros | Cons |
|---|---|
| Low monthly payments – more cash for savings and other important expenses | Higher interest rates – can be 0.25 percent 1 percent higher than a 15-year fixed-rate term |
| It’s easier to qualify for a 30-year fixed-rate loan than shorter terms | Pay higher total interest costs compared to shorter terms |
| You have higher chances of qualifying for a larger loan amount with a 30-year fixed mortgage | It will take longer to pay down your loan, you won’t gain equity/homeownership sooner |
| Payments remain fixed – no need to worry about increasing payments in the future | May require higher maintenance expenses – a larger home means costly maintenance and property insurance |
If you can afford higher payments, it’s beneficial to take a shorter term. Shorter loans come with lower rates sans the extra years of interest charges. Paying your mortgage faster also means you gain ownership of your home sooner.
However, if you can only qualify for a 30-year fixed term, be sure to get the lowest rate possible. A lower rate yields lower interest charges which saves more money over a higher interest loan. Shop around for different lenders and choose one that offers the lowest rate. Moreover, make an effort to increase your credit score so you can obtain the best rate.

Check Your Credit Report
Before qualifying for a mortgage, check your credit report. Any misinformation (e.g. undocumented payments) can lower your credit score. Disputing errors to your credit bureau is a direct way of improving your credit rating. Borrowers are entitled to one free copy of their credit report every 12 months. You can order it online at annualcreditreport.com.
Mortgage Options That Offer 30-Year Fixed-Rate Loans
You can practically get a 30-year fixed-rate loan from most mortgage lenders. However, it’s important to know what options are out there so you can narrow down your search. You can obtain 30-year fixed-rate loans from the following types of conventional loans and government-sponsored financing:
Conforming Conventional Loans

A mortgage is a called a conventional loan when it is not federally sponsored by the government. These are offered by private lenders such as mortgage companies, banks, and credit unions. To be eligible for a conventional loan, you must have a credit score of 650 and above. That said, this option is usually obtained by borrowers with high credit rating, stable funds, and a large income.
Another important qualifying factor is debt-to-income ratio (DTI). This is the ratio of your income compared to your debts expressed in percentage. There are two important types of DTI ratios:
- Front-end ratio – The percentage of your income that goes toward housing expenses such as mortgage payments, property taxes, insurance, and homeowner’s association fees
- Back-end ratio – The percentage of your income that goes toward housing expenses and all other types of debt such as credit card payments, car loans, student loans, etc.
For conventional loans, a borrower must have a maximum front-end DTI ratio of 28 percent. Back-end DTI ratio should ideally be 43 percent. It should not go over 43 percent, but borrowers with student loans may qualify with 50 percent.
Private Mortgage Insurance (PMI)
Conventional loans charge a private mortgage insurance if your downpayment is less than 20 percent of the home’s value. This premium is usually added to your monthly mortgage. Though in some cases, it’s paid upfront during closing.
Can PMI be canceled? PMI is automatically removed when your outstanding balance reaches 78 percent. It’s also terminated once you’ve paid half of your amortization schedule.
A conventional loan is classified as a conforming conventional loan when it falls under prescribed financing limits prescribed by the Federal Housing Finance Agency (FHFA). Under the law, financing limits must be adjusted annually to reflect changes in housing prices.
For example, in 2025, the conforming limit for a 2-unit housing throughout the continental U.S. baseline is $1,032,650. If a mortgage exceeds this limit, it is considered a non-conforming conventional loan.
Non-Conforming Conventional Loans
Another term for a non-conforming conventional loan is a jumbo mortgage. This type of conventional loan is appropriate for borrowers with higher income and a stable source of funds. Non-conforming conventional loans surpass the financing limit established by the FHFA. For instance, if the conforming limit for a 2-unit housing is $1,032,650 and your loan is $1,250,000, it’s considered a jumbo mortgage.
Only applicants with high credit scores not lower than 700 can qualify for jumbo mortgages. Jumbo refers to the large amount of the loan, which is used to purchase expensive property. Qualifying for this type of loan involves more thorough background checks by lenders.
Government-sponsored Housing Loans
Not everyone can qualify for a conventional loan. When this happens, borrowers can turn to government-backed mortgages. These are loans specially sponsored by the government to help low to moderate-income families afford a home. Generally, it’s easier to qualify for government-backed 30-year fixed loans compared to conventional loans. For instance, you can qualify for an FHA loan with a 500 credit score as long as you make a 10 percent downpayment.
Mortgage Insurance Premium (MIP)
With government-backed loans such as FHA or USDA loans, you are charged a mortgage insurance premium. This is required if your loan balance is 80 percent of the home’s value. It offsets the low downpayment provided by government-sponsored loans.
MIP is a premium that’s around 0.80 to 0.85 percent of your home loan. It’s paid for the entire loan term and cannot be canceled. The only way to remove MIP is to refinance to a new mortgage.
Below are examples of government-sponsored mortgages:
Federal Housing Administration Loans (FHA)

The FHA provides housing programs suitable for first-time homebuyers. It allows borrowers to qualify even if they have low credit scores. With FHA loans, you can make a smaller downpayment to obtain a 30-year fixed-rate mortgage. This makes it a popular financing option for buyers with tight finances. FHA loans come in 15 and 30-year fixed terms, as well as 20-year terms.
Qualifying for FHA Loans
Under the FHA program, if your credit score is 500, your downpayment should be 10% of the loan amount. But if your credit score is at least 580, your downpayment can be as low as 3.5 percent.
As for DTI ratio requirements, your front-end DTI should not be lower than 31 percent. Your back-end DTI should not exceed 43 percent, though some borrowers qualify at 50 percent with compensating factors.
In the beginning, FHA loans are affordable for homeowners because of low rates. But after several years of payments, it gets costly because of mortgage insurance premium (MIP). In an annual basis, the MIP cost is around 0.45 percent to 1.05 percent of the loan amount. The rates increase as you gain more home equity.
How to Remove Mortgage Insurance Premium
To eliminate MIP, homeowners can refinance their FHA loan into a 15 or 20-year conventional loan. Mortgage refinancing is taking out a new loan to replace an existing loan. This is strategically done to lower your interest rate and shorten your mortgage term. But take note: refinancing to a conventional loan requires a credit score of 620. It also costs around 2 to 6 percent of your loan.
Can’t afford to refinance? You can make extra payments to your FHA loan. Unlike many conventional loans, FHA does not impose a prepayment penalty. This means you can make additional payments toward your principal without penalty charges. It will help reduce your outstanding balance as well as your overall interest charges. It’s also a good way to remove years of your loan term.
U.S. Department of Agriculture loans (USDA)

USDA loans are geared towards homebuyers with low to moderate incomes. It provides a zero downpayment option to borrowers with credit scores not lower than 640. The USDA home financing program was designed to aid economic development in areas with low populations in the country.
To be eligible for a USDA loan, you must purchase a house in a USDA rural area. This may seem like a limitation if you want to live in a city. However, 97 percent of land in the U.S. is actually qualified for USDA home financing. You just might find a house near a good location. Consider this option before you cross it out your list.
Qualifying for USDA Loans
To qualify for a USDA loan, borrowers should have a minimum credit score of 640. If your credit rating is lower than 640, you must provide additional documentation of your payment history to get approval. For front-end DTI ratio, you must not go beyond 29 percent. Likewise, your back-end DTI ratio must not be over 41 percent.
Be sure to check the USDA income limits in your preferred home location. This will also determine if you can obtain a USDA loan. There are different income limits for households with 1 to 4 members and larger families with 5 to 8 family members. For example, under the 2008 Housing and Economic Recovery Act (HERA), high-cost areas for 1 to 4 member households are set at $212,55.
Since USDA loans are federally funded, interest rates are lower compared to conventional loans. Though there is a zero downpayment option, borrowers are charged an upfront guarantee fee equal to 1 percent of the loan per month. Buyers are also charged a mortgage insurance premium (MIP), which is around 0.35 percent of loan annually.
Finally, USDA loans also do not enforce prepayment penalties. You can make extra payments toward your principal to reduce you interest charges. This will help you removes months or years off your payment term.
U.S. Department of Veterans Affairs Loans (VA)

VA housing loans are granted specifically for active-duty military members, veterans, and eligible family members. It is also available to servicing staff in the National Guard and Reserves.
As an incentive for their service, active duty members and military veterans can get flexible, low-interest housing rates. Downpayments are also not required for this type of loan. And unlike FHA and USDA loans, it does not impose private mortgage insurance (PMI).
Qualifying for VA Housing Loans
Of course, you must be an active-duty member or a retired service member to apply for this loan. Qualified members must have a minimum credit score of 620 to obtain VA loans. As for DTI ratio, it primarily uses back-end DTI ratio for qualifying basis. Your back-end DTI should be no higher than 41 percent. Some borrowers with residual income can qualify with a higher back-end DTI.
Though there’s no PMI required, qualified borrowers are charged a VA funding fee to compensate for taxpayer’s costs. This fee is paid upfront, in closing, or is rolled into your monthly payments. Some qualifying members may be exempted from paying it. VA funding fees vary for members — you may check this VA funding fee table for full details.
VA housing loans do not charge prepayment penalties. You can keep making additional payments to pay off your mortgage early. Likewise, paying your loan early saves a significant amount of interest costs.
How Popular are 30-Year Fixed-Rate Mortgages?
Thirty-year fixed-rate loans remain the most popular type of financing for homebuyers. Due to its low monthly payments, more people obtain 30-year fixed mortgages. Consumers are likely to qualify for this loan compared to shorter mortgage terms. Though it’s the longest loan-term available (which means longer debt), people take advantage of this option to secure homes they need.
In a comprehensive report conducted by the Urban Institute, 30-year fixed rate loans accounted for 77 percent of new mortgage originations in April 2020. The chart below illustrates how 30-year mortgages take up most of the market share from 2000 to April 2020. The data is based on the Urban Institute’s Housing Finance at a Glance: A Monthly Chartbook June 2020.
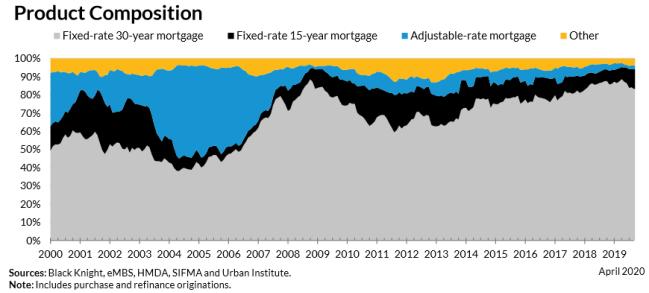
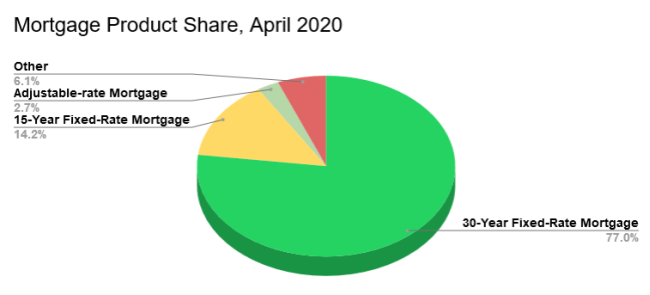
Thirty-year fixed mortgages are trailed by 15-year fixed-rate loans. According to the same report, it accounted for 14.2 percent of new mortgages in April 2020. Meanwhile, adjustable-rate mortgages represented 2.7 percent of new originations in April 2020. The “Other” category reflected around 6.1 of the market share. This includes loan options such as 10, 20, and 25-year mortgages.
The pie chart below represents the April 2020 mortgage product market share:
Moreover, since interest rates have decreased in 2018, the refinance share has increased for both government-sponsored loans and Ginnie Mae loans. The Urban Institute states that government-sponsored loans represent between 75 to 77 percent of refinances, while Ginnie Mae accounted for 53.4 percent of refinances.
How Rates Have Changed for 30-Year Fixed Mortgages
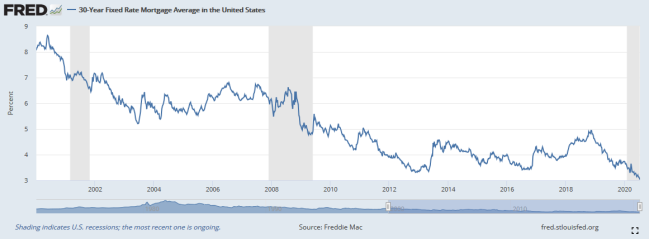
Historically speaking, mortgage rates for 30-year fixed loans have been gradually declining. If we take a look at average rates from 2000 to 2020, it shows points were average rates have significantly decreased. The graph below is taken from the Federal Reserve Bank of St. Louis. We also compiled a table showing average rates from January 2000 to January 2020.
Based on the FRED graph, the 30-year fixed mortgage started with an average rate of 8.15 percent in January 2020. Over the next couple of years between 2001 to 2008, it fluctuates between 7.07 percent and 5.85 percent.
| Date | Average 30-Year Fixed Mortgage Rates |
|---|---|
| January 7, 2000 | 8.15% |
| January 5, 2001 | 7.07% |
| January 4, 2002 | 7.14% |
| January 3, 2003 | 5.85% |
| January 8, 2004 | 5.87% |
| January 6, 2005 | 5.77% |
| January 5, 2006 | 6.21% |
| January 4, 2007 | 6.18% |
| January 3, 2008 | 6.07% |
| January 8, 2009 | 5.01% |
| January 7, 2010 | 5.09% |
| January 6, 2011 | 4.77% |
| January 5, 2012 | 3.91% |
| January 3, 2013 | 3.34% |
| January 2, 2014 | 4.53% |
| January 8, 2015 | 3.73% |
| January 7, 2016 | 3.97% |
| January 5, 2017 | 4.20% |
| January 4, 2018 | 3.95% |
| January 3, 2019 | 4.51% |
| January 2, 2020 | 3.72% |
By January 2008, you’ll notice a substantial drop down to 5.01 percent. During this period, the effects of the subprime mortgage crisis gravely affected consumers and lending institutions. According to historical accounts, the mortgage crisis aggravated the U.S. recession in December 2007 to June 2009.
In January 2009, the average 30-year fixed mortgage rate dropped by 1.06 percentage points from 2008. It increased to 5.09 percent in 2010, but went down to 4.77 percent in 2011. Between January 2012 to 2017, the average rate ranged between 3.34 percent to 4.53 percent. In 2017, it reaches 4.20 percent, but continues to fluctuate downward to 3.95 percent in January 2018.
Come January 2019, the average rate was at 4.51 percent. However, it dropped significantly in the latter months of 2019, prompting more homeowners to refinance their loans. By January 2020, rates dropped by almost 1 percentage point to 3.72 percent.
During the first quarter of 2020, the U.S. was affected by the coronavirus pandemic. Due to this unprecedented crisis, many companies were forced to shutdown due to stay-at-home and social distancing measures. The Bureau of Labor Statistics reported that unemployment rates rose to 14.7 percent in April 2020, the highest since the Great Depression.
Despite the threat of job loss during the crises, refinancing became prevalent among homebuyers. Borrowers take advantage of the low rates to secure better terms. Meanwhile, the government rolled out aid programs to provide financial assistance and loan payment extensions to affected citizens.
Managing Your Mortgage Payments

Purchasing a 30-year fixed loan means making consistent payments for three decades. That’s a long time, so you must stay on top of your payments. This is why it’s important to secure a stable career and build savings. You must keep paying your loan even during emergencies. The same goes even when you’re retired and not yet fully paid on your loan.
Before you agree to any real estate deal, you should understand how mortgage payments work. One important document you should use is the amortization schedule. This breaks down your monthly payments so you know how much goes toward your interest charges and principal loan.
- Principal – This is the amount you borrowed from your lender. It also indicated the outstanding balance you still owe after making several payments.
- Interest – This is the payment lenders charge to service your loan. Interest costs are higher when your principal is large. Likewise, interest increases the longer it takes to pay down a loan.
Calculate Your PITI Costs
Mortgage payments are not just comprised of interest and principal payments. You must also pay for real estate taxes and homeowner’s insurance. When taken together, this is called PITI costs or Principal, Interest, Taxes, and Insurance. If you check your PITI expense, you can calculate the total cost of your monthly payments. Finally, while principal and interest payments remain the same, your insurance and property taxes may change over the years.
Again, you can make extra payments toward your principal to reduce your balance. This lowers interest charges and helps shorter your loan term. If you have a government-backed 30-year fixed mortgages, you don’t have to worry about prepayment penalties. However, if you have a conventional loan, it’s best to check with your lender to avoid costly prepayment penalty fees.
Loan Amortization
Need a sample amortization schedule for a 30-year fixed mortgage? Use our calculator above.
The following table shows the amortization on a 30-year $250,000 home loan at 4.8% APR for a loan that begins next year. On this example loan, payments being on August 31, 2026 for a loan originated on July 31, 2026.
You can generate a similar printable table using the above calculator by clicking on the [Inline Schedule] button. If you would like to print out your amortization schedule please click on the [Printable Schedule] button.
| PMNT | Date | Payment | Principal | Interest | Balance |
|---|---|---|---|---|---|
| 1 | 8/31/2026 | $1,311.66 | $311.66 | $1,000.00 | $249,688.34 |
| 2 | 9/30/2026 | $1,311.66 | $312.91 | $998.75 | $249,375.43 |
| 3 | 10/31/2026 | $1,311.66 | $314.16 | $997.50 | $249,061.27 |
| 4 | 11/30/2026 | $1,311.66 | $315.41 | $996.25 | $248,745.86 |
| 5 | 12/31/2026 | $1,311.66 | $316.68 | $994.98 | $248,429.18 |
| Year 2026 | $6,558.30 | $1,570.82 | $4,987.48 | $248,429.18 | |
| 6 | 1/31/2027 | $1,311.66 | $317.94 | $993.72 | $248,111.24 |
| 7 | 2/28/2027 | $1,311.66 | $319.22 | $992.44 | $247,792.02 |
| 8 | 3/31/2027 | $1,311.66 | $320.49 | $991.17 | $247,471.53 |
| 9 | 4/30/2027 | $1,311.66 | $321.77 | $989.89 | $247,149.76 |
| 10 | 5/31/2027 | $1,311.66 | $323.06 | $988.60 | $246,826.70 |
| 11 | 6/30/2027 | $1,311.66 | $324.35 | $987.31 | $246,502.35 |
| 12 | 7/31/2027 | $1,311.66 | $325.65 | $986.01 | $246,176.70 |
| 13 | 8/31/2027 | $1,311.66 | $326.95 | $984.71 | $245,849.75 |
| 14 | 9/30/2027 | $1,311.66 | $328.26 | $983.40 | $245,521.49 |
| 15 | 10/31/2027 | $1,311.66 | $329.57 | $982.09 | $245,191.92 |
| 16 | 11/30/2027 | $1,311.66 | $330.89 | $980.77 | $244,861.03 |
| 17 | 12/31/2027 | $1,311.66 | $332.22 | $979.44 | $244,528.81 |
| Year 2027 | $15,739.92 | $3,900.37 | $11,839.55 | $244,528.81 | |
| 18 | 1/31/2028 | $1,311.66 | $333.54 | $978.12 | $244,195.27 |
| 19 | 2/28/2028 | $1,311.66 | $334.88 | $976.78 | $243,860.39 |
| 20 | 3/31/2028 | $1,311.66 | $336.22 | $975.44 | $243,524.17 |
| 21 | 4/30/2028 | $1,311.66 | $337.56 | $974.10 | $243,186.61 |
| 22 | 5/31/2028 | $1,311.66 | $338.91 | $972.75 | $242,847.70 |
| 23 | 6/30/2028 | $1,311.66 | $340.27 | $971.39 | $242,507.43 |
| 24 | 7/31/2028 | $1,311.66 | $341.63 | $970.03 | $242,165.80 |
| 25 | 8/31/2028 | $1,311.66 | $343.00 | $968.66 | $241,822.80 |
| 26 | 9/30/2028 | $1,311.66 | $344.37 | $967.29 | $241,478.43 |
| 27 | 10/31/2028 | $1,311.66 | $345.75 | $965.91 | $241,132.68 |
| 28 | 11/30/2028 | $1,311.66 | $347.13 | $964.53 | $240,785.55 |
| 29 | 12/31/2028 | $1,311.66 | $348.52 | $963.14 | $240,437.03 |
| Year 2028 | $15,739.92 | $4,091.78 | $11,648.14 | $240,437.03 | |
| 30 | 1/31/2029 | $1,311.66 | $349.91 | $961.75 | $240,087.12 |
| 31 | 2/28/2029 | $1,311.66 | $351.31 | $960.35 | $239,735.81 |
| 32 | 3/31/2029 | $1,311.66 | $352.72 | $958.94 | $239,383.09 |
| 33 | 4/30/2029 | $1,311.66 | $354.13 | $957.53 | $239,028.96 |
| 34 | 5/31/2029 | $1,311.66 | $355.54 | $956.12 | $238,673.42 |
| 35 | 6/30/2029 | $1,311.66 | $356.97 | $954.69 | $238,316.45 |
| 36 | 7/31/2029 | $1,311.66 | $358.39 | $953.27 | $237,958.06 |
| 37 | 8/31/2029 | $1,311.66 | $359.83 | $951.83 | $237,598.23 |
| 38 | 9/30/2029 | $1,311.66 | $361.27 | $950.39 | $237,236.96 |
| 39 | 10/31/2029 | $1,311.66 | $362.71 | $948.95 | $236,874.25 |
| 40 | 11/30/2029 | $1,311.66 | $364.16 | $947.50 | $236,510.09 |
| 41 | 12/31/2029 | $1,311.66 | $365.62 | $946.04 | $236,144.47 |
| Year 2029 | $15,739.92 | $4,292.56 | $11,447.36 | $236,144.47 | |
| 42 | 1/31/2030 | $1,311.66 | $367.08 | $944.58 | $235,777.39 |
| 43 | 2/28/2030 | $1,311.66 | $368.55 | $943.11 | $235,408.84 |
| 44 | 3/31/2030 | $1,311.66 | $370.02 | $941.64 | $235,038.82 |
| 45 | 4/30/2030 | $1,311.66 | $371.50 | $940.16 | $234,667.32 |
| 46 | 5/31/2030 | $1,311.66 | $372.99 | $938.67 | $234,294.33 |
| 47 | 6/30/2030 | $1,311.66 | $374.48 | $937.18 | $233,919.85 |
| 48 | 7/31/2030 | $1,311.66 | $375.98 | $935.68 | $233,543.87 |
| 49 | 8/31/2030 | $1,311.66 | $377.48 | $934.18 | $233,166.39 |
| 50 | 9/30/2030 | $1,311.66 | $378.99 | $932.67 | $232,787.40 |
| 51 | 10/31/2030 | $1,311.66 | $380.51 | $931.15 | $232,406.89 |
| 52 | 11/30/2030 | $1,311.66 | $382.03 | $929.63 | $232,024.86 |
| 53 | 12/31/2030 | $1,311.66 | $383.56 | $928.10 | $231,641.30 |
| Year 2030 | $15,739.92 | $4,503.17 | $11,236.75 | $231,641.30 | |
| 54 | 1/31/2031 | $1,311.66 | $385.09 | $926.57 | $231,256.21 |
| 55 | 2/28/2031 | $1,311.66 | $386.64 | $925.02 | $230,869.57 |
| 56 | 3/31/2031 | $1,311.66 | $388.18 | $923.48 | $230,481.39 |
| 57 | 4/30/2031 | $1,311.66 | $389.73 | $921.93 | $230,091.66 |
| 58 | 5/31/2031 | $1,311.66 | $391.29 | $920.37 | $229,700.37 |
| 59 | 6/30/2031 | $1,311.66 | $392.86 | $918.80 | $229,307.51 |
| 60 | 7/31/2031 | $1,311.66 | $394.43 | $917.23 | $228,913.08 |
| 61 | 8/31/2031 | $1,311.66 | $396.01 | $915.65 | $228,517.07 |
| 62 | 9/30/2031 | $1,311.66 | $397.59 | $914.07 | $228,119.48 |
| 63 | 10/31/2031 | $1,311.66 | $399.18 | $912.48 | $227,720.30 |
| 64 | 11/30/2031 | $1,311.66 | $400.78 | $910.88 | $227,319.52 |
| 65 | 12/31/2031 | $1,311.66 | $402.38 | $909.28 | $226,917.14 |
| Year 2031 | $15,739.92 | $4,724.16 | $11,015.76 | $226,917.14 | |
| 66 | 1/31/2032 | $1,311.66 | $403.99 | $907.67 | $226,513.15 |
| 67 | 2/28/2032 | $1,311.66 | $405.61 | $906.05 | $226,107.54 |
| 68 | 3/31/2032 | $1,311.66 | $407.23 | $904.43 | $225,700.31 |
| 69 | 4/30/2032 | $1,311.66 | $408.86 | $902.80 | $225,291.45 |
| 70 | 5/31/2032 | $1,311.66 | $410.49 | $901.17 | $224,880.96 |
| 71 | 6/30/2032 | $1,311.66 | $412.14 | $899.52 | $224,468.82 |
| 72 | 7/31/2032 | $1,311.66 | $413.78 | $897.88 | $224,055.04 |
| 73 | 8/31/2032 | $1,311.66 | $415.44 | $896.22 | $223,639.60 |
| 74 | 9/30/2032 | $1,311.66 | $417.10 | $894.56 | $223,222.50 |
| 75 | 10/31/2032 | $1,311.66 | $418.77 | $892.89 | $222,803.73 |
| 76 | 11/30/2032 | $1,311.66 | $420.45 | $891.21 | $222,383.28 |
| 77 | 12/31/2032 | $1,311.66 | $422.13 | $889.53 | $221,961.15 |
| Year 2032 | $15,739.92 | $4,955.99 | $10,783.93 | $221,961.15 | |
| 78 | 1/31/2033 | $1,311.66 | $423.82 | $887.84 | $221,537.33 |
| 79 | 2/28/2033 | $1,311.66 | $425.51 | $886.15 | $221,111.82 |
| 80 | 3/31/2033 | $1,311.66 | $427.21 | $884.45 | $220,684.61 |
| 81 | 4/30/2033 | $1,311.66 | $428.92 | $882.74 | $220,255.69 |
| 82 | 5/31/2033 | $1,311.66 | $430.64 | $881.02 | $219,825.05 |
| 83 | 6/30/2033 | $1,311.66 | $432.36 | $879.30 | $219,392.69 |
| 84 | 7/31/2033 | $1,311.66 | $434.09 | $877.57 | $218,958.60 |
| 85 | 8/31/2033 | $1,311.66 | $435.83 | $875.83 | $218,522.77 |
| 86 | 9/30/2033 | $1,311.66 | $437.57 | $874.09 | $218,085.20 |
| 87 | 10/31/2033 | $1,311.66 | $439.32 | $872.34 | $217,645.88 |
| 88 | 11/30/2033 | $1,311.66 | $441.08 | $870.58 | $217,204.80 |
| 89 | 12/31/2033 | $1,311.66 | $442.84 | $868.82 | $216,761.96 |
| Year 2033 | $15,739.92 | $5,199.19 | $10,540.73 | $216,761.96 | |
| 90 | 1/31/2034 | $1,311.66 | $444.61 | $867.05 | $216,317.35 |
| 91 | 2/28/2034 | $1,311.66 | $446.39 | $865.27 | $215,870.96 |
| 92 | 3/31/2034 | $1,311.66 | $448.18 | $863.48 | $215,422.78 |
| 93 | 4/30/2034 | $1,311.66 | $449.97 | $861.69 | $214,972.81 |
| 94 | 5/31/2034 | $1,311.66 | $451.77 | $859.89 | $214,521.04 |
| 95 | 6/30/2034 | $1,311.66 | $453.58 | $858.08 | $214,067.46 |
| 96 | 7/31/2034 | $1,311.66 | $455.39 | $856.27 | $213,612.07 |
| 97 | 8/31/2034 | $1,311.66 | $457.21 | $854.45 | $213,154.86 |
| 98 | 9/30/2034 | $1,311.66 | $459.04 | $852.62 | $212,695.82 |
| 99 | 10/31/2034 | $1,311.66 | $460.88 | $850.78 | $212,234.94 |
| 100 | 11/30/2034 | $1,311.66 | $462.72 | $848.94 | $211,772.22 |
| 101 | 12/31/2034 | $1,311.66 | $464.57 | $847.09 | $211,307.65 |
| Year 2034 | $15,739.92 | $5,454.31 | $10,285.61 | $211,307.65 | |
| 102 | 1/31/2035 | $1,311.66 | $466.43 | $845.23 | $210,841.22 |
| 103 | 2/28/2035 | $1,311.66 | $468.30 | $843.36 | $210,372.92 |
| 104 | 3/31/2035 | $1,311.66 | $470.17 | $841.49 | $209,902.75 |
| 105 | 4/30/2035 | $1,311.66 | $472.05 | $839.61 | $209,430.70 |
| 106 | 5/31/2035 | $1,311.66 | $473.94 | $837.72 | $208,956.76 |
| 107 | 6/30/2035 | $1,311.66 | $475.83 | $835.83 | $208,480.93 |
| 108 | 7/31/2035 | $1,311.66 | $477.74 | $833.92 | $208,003.19 |
| 109 | 8/31/2035 | $1,311.66 | $479.65 | $832.01 | $207,523.54 |
| 110 | 9/30/2035 | $1,311.66 | $481.57 | $830.09 | $207,041.97 |
| 111 | 10/31/2035 | $1,311.66 | $483.49 | $828.17 | $206,558.48 |
| 112 | 11/30/2035 | $1,311.66 | $485.43 | $826.23 | $206,073.05 |
| 113 | 12/31/2035 | $1,311.66 | $487.37 | $824.29 | $205,585.68 |
| Year 2035 | $15,739.92 | $5,721.97 | $10,017.95 | $205,585.68 | |
| 114 | 1/31/2036 | $1,311.66 | $489.32 | $822.34 | $205,096.36 |
| 115 | 2/28/2036 | $1,311.66 | $491.27 | $820.39 | $204,605.09 |
| 116 | 3/31/2036 | $1,311.66 | $493.24 | $818.42 | $204,111.85 |
| 117 | 4/30/2036 | $1,311.66 | $495.21 | $816.45 | $203,616.64 |
| 118 | 5/31/2036 | $1,311.66 | $497.19 | $814.47 | $203,119.45 |
| 119 | 6/30/2036 | $1,311.66 | $499.18 | $812.48 | $202,620.27 |
| 120 | 7/31/2036 | $1,311.66 | $501.18 | $810.48 | $202,119.09 |
| 121 | 8/31/2036 | $1,311.66 | $503.18 | $808.48 | $201,615.91 |
| 122 | 9/30/2036 | $1,311.66 | $505.20 | $806.46 | $201,110.71 |
| 123 | 10/31/2036 | $1,311.66 | $507.22 | $804.44 | $200,603.49 |
| 124 | 11/30/2036 | $1,311.66 | $509.25 | $802.41 | $200,094.24 |
| 125 | 12/31/2036 | $1,311.66 | $511.28 | $800.38 | $199,582.96 |
| Year 2036 | $15,739.92 | $6,002.72 | $9,737.20 | $199,582.96 | |
| 126 | 1/31/2037 | $1,311.66 | $513.33 | $798.33 | $199,069.63 |
| 127 | 2/28/2037 | $1,311.66 | $515.38 | $796.28 | $198,554.25 |
| 128 | 3/31/2037 | $1,311.66 | $517.44 | $794.22 | $198,036.81 |
| 129 | 4/30/2037 | $1,311.66 | $519.51 | $792.15 | $197,517.30 |
| 130 | 5/31/2037 | $1,311.66 | $521.59 | $790.07 | $196,995.71 |
| 131 | 6/30/2037 | $1,311.66 | $523.68 | $787.98 | $196,472.03 |
| 132 | 7/31/2037 | $1,311.66 | $525.77 | $785.89 | $195,946.26 |
| 133 | 8/31/2037 | $1,311.66 | $527.87 | $783.79 | $195,418.39 |
| 134 | 9/30/2037 | $1,311.66 | $529.99 | $781.67 | $194,888.40 |
| 135 | 10/31/2037 | $1,311.66 | $532.11 | $779.55 | $194,356.29 |
| 136 | 11/30/2037 | $1,311.66 | $534.23 | $777.43 | $193,822.06 |
| 137 | 12/31/2037 | $1,311.66 | $536.37 | $775.29 | $193,285.69 |
| Year 2037 | $15,739.92 | $6,297.27 | $9,442.65 | $193,285.69 | |
| 138 | 1/31/2038 | $1,311.66 | $538.52 | $773.14 | $192,747.17 |
| 139 | 2/28/2038 | $1,311.66 | $540.67 | $770.99 | $192,206.50 |
| 140 | 3/31/2038 | $1,311.66 | $542.83 | $768.83 | $191,663.67 |
| 141 | 4/30/2038 | $1,311.66 | $545.01 | $766.65 | $191,118.66 |
| 142 | 5/31/2038 | $1,311.66 | $547.19 | $764.47 | $190,571.47 |
| 143 | 6/30/2038 | $1,311.66 | $549.37 | $762.29 | $190,022.10 |
| 144 | 7/31/2038 | $1,311.66 | $551.57 | $760.09 | $189,470.53 |
| 145 | 8/31/2038 | $1,311.66 | $553.78 | $757.88 | $188,916.75 |
| 146 | 9/30/2038 | $1,311.66 | $555.99 | $755.67 | $188,360.76 |
| 147 | 10/31/2038 | $1,311.66 | $558.22 | $753.44 | $187,802.54 |
| 148 | 11/30/2038 | $1,311.66 | $560.45 | $751.21 | $187,242.09 |
| 149 | 12/31/2038 | $1,311.66 | $562.69 | $748.97 | $186,679.40 |
| Year 2038 | $15,739.92 | $6,606.29 | $9,133.63 | $186,679.40 | |
| 150 | 1/31/2039 | $1,311.66 | $564.94 | $746.72 | $186,114.46 |
| 151 | 2/28/2039 | $1,311.66 | $567.20 | $744.46 | $185,547.26 |
| 152 | 3/31/2039 | $1,311.66 | $569.47 | $742.19 | $184,977.79 |
| 153 | 4/30/2039 | $1,311.66 | $571.75 | $739.91 | $184,406.04 |
| 154 | 5/31/2039 | $1,311.66 | $574.04 | $737.62 | $183,832.00 |
| 155 | 6/30/2039 | $1,311.66 | $576.33 | $735.33 | $183,255.67 |
| 156 | 7/31/2039 | $1,311.66 | $578.64 | $733.02 | $182,677.03 |
| 157 | 8/31/2039 | $1,311.66 | $580.95 | $730.71 | $182,096.08 |
| 158 | 9/30/2039 | $1,311.66 | $583.28 | $728.38 | $181,512.80 |
| 159 | 10/31/2039 | $1,311.66 | $585.61 | $726.05 | $180,927.19 |
| 160 | 11/30/2039 | $1,311.66 | $587.95 | $723.71 | $180,339.24 |
| 161 | 12/31/2039 | $1,311.66 | $590.30 | $721.36 | $179,748.94 |
| Year 2039 | $15,739.92 | $6,930.46 | $8,809.46 | $179,748.94 | |
| 162 | 1/31/2040 | $1,311.66 | $592.66 | $719.00 | $179,156.28 |
| 163 | 2/28/2040 | $1,311.66 | $595.03 | $716.63 | $178,561.25 |
| 164 | 3/31/2040 | $1,311.66 | $597.41 | $714.25 | $177,963.84 |
| 165 | 4/30/2040 | $1,311.66 | $599.80 | $711.86 | $177,364.04 |
| 166 | 5/31/2040 | $1,311.66 | $602.20 | $709.46 | $176,761.84 |
| 167 | 6/30/2040 | $1,311.66 | $604.61 | $707.05 | $176,157.23 |
| 168 | 7/31/2040 | $1,311.66 | $607.03 | $704.63 | $175,550.20 |
| 169 | 8/31/2040 | $1,311.66 | $609.46 | $702.20 | $174,940.74 |
| 170 | 9/30/2040 | $1,311.66 | $611.90 | $699.76 | $174,328.84 |
| 171 | 10/31/2040 | $1,311.66 | $614.34 | $697.32 | $173,714.50 |
| 172 | 11/30/2040 | $1,311.66 | $616.80 | $694.86 | $173,097.70 |
| 173 | 12/31/2040 | $1,311.66 | $619.27 | $692.39 | $172,478.43 |
| Year 2040 | $15,739.92 | $7,270.51 | $8,469.41 | $172,478.43 | |
| 174 | 1/31/2041 | $1,311.66 | $621.75 | $689.91 | $171,856.68 |
| 175 | 2/28/2041 | $1,311.66 | $624.23 | $687.43 | $171,232.45 |
| 176 | 3/31/2041 | $1,311.66 | $626.73 | $684.93 | $170,605.72 |
| 177 | 4/30/2041 | $1,311.66 | $629.24 | $682.42 | $169,976.48 |
| 178 | 5/31/2041 | $1,311.66 | $631.75 | $679.91 | $169,344.73 |
| 179 | 6/30/2041 | $1,311.66 | $634.28 | $677.38 | $168,710.45 |
| 180 | 7/31/2041 | $1,311.66 | $636.82 | $674.84 | $168,073.63 |
| 181 | 8/31/2041 | $1,311.66 | $639.37 | $672.29 | $167,434.26 |
| 182 | 9/30/2041 | $1,311.66 | $641.92 | $669.74 | $166,792.34 |
| 183 | 10/31/2041 | $1,311.66 | $644.49 | $667.17 | $166,147.85 |
| 184 | 11/30/2041 | $1,311.66 | $647.07 | $664.59 | $165,500.78 |
| 185 | 12/31/2041 | $1,311.66 | $649.66 | $662.00 | $164,851.12 |
| Year 2041 | $15,739.92 | $7,627.31 | $8,112.61 | $164,851.12 | |
| 186 | 1/31/2042 | $1,311.66 | $652.26 | $659.40 | $164,198.86 |
| 187 | 2/28/2042 | $1,311.66 | $654.86 | $656.80 | $163,544.00 |
| 188 | 3/31/2042 | $1,311.66 | $657.48 | $654.18 | $162,886.52 |
| 189 | 4/30/2042 | $1,311.66 | $660.11 | $651.55 | $162,226.41 |
| 190 | 5/31/2042 | $1,311.66 | $662.75 | $648.91 | $161,563.66 |
| 191 | 6/30/2042 | $1,311.66 | $665.41 | $646.25 | $160,898.25 |
| 192 | 7/31/2042 | $1,311.66 | $668.07 | $643.59 | $160,230.18 |
| 193 | 8/31/2042 | $1,311.66 | $670.74 | $640.92 | $159,559.44 |
| 194 | 9/30/2042 | $1,311.66 | $673.42 | $638.24 | $158,886.02 |
| 195 | 10/31/2042 | $1,311.66 | $676.12 | $635.54 | $158,209.90 |
| 196 | 11/30/2042 | $1,311.66 | $678.82 | $632.84 | $157,531.08 |
| 197 | 12/31/2042 | $1,311.66 | $681.54 | $630.12 | $156,849.54 |
| Year 2042 | $15,739.92 | $8,001.58 | $7,738.34 | $156,849.54 | |
| 198 | 1/31/2043 | $1,311.66 | $684.26 | $627.40 | $156,165.28 |
| 199 | 2/28/2043 | $1,311.66 | $687.00 | $624.66 | $155,478.28 |
| 200 | 3/31/2043 | $1,311.66 | $689.75 | $621.91 | $154,788.53 |
| 201 | 4/30/2043 | $1,311.66 | $692.51 | $619.15 | $154,096.02 |
| 202 | 5/31/2043 | $1,311.66 | $695.28 | $616.38 | $153,400.74 |
| 203 | 6/30/2043 | $1,311.66 | $698.06 | $613.60 | $152,702.68 |
| 204 | 7/31/2043 | $1,311.66 | $700.85 | $610.81 | $152,001.83 |
| 205 | 8/31/2043 | $1,311.66 | $703.65 | $608.01 | $151,298.18 |
| 206 | 9/30/2043 | $1,311.66 | $706.47 | $605.19 | $150,591.71 |
| 207 | 10/31/2043 | $1,311.66 | $709.29 | $602.37 | $149,882.42 |
| 208 | 11/30/2043 | $1,311.66 | $712.13 | $599.53 | $149,170.29 |
| 209 | 12/31/2043 | $1,311.66 | $714.98 | $596.68 | $148,455.31 |
| Year 2043 | $15,739.92 | $8,394.23 | $7,345.69 | $148,455.31 | |
| 210 | 1/31/2044 | $1,311.66 | $717.84 | $593.82 | $147,737.47 |
| 211 | 2/28/2044 | $1,311.66 | $720.71 | $590.95 | $147,016.76 |
| 212 | 3/31/2044 | $1,311.66 | $723.59 | $588.07 | $146,293.17 |
| 213 | 4/30/2044 | $1,311.66 | $726.49 | $585.17 | $145,566.68 |
| 214 | 5/31/2044 | $1,311.66 | $729.39 | $582.27 | $144,837.29 |
| 215 | 6/30/2044 | $1,311.66 | $732.31 | $579.35 | $144,104.98 |
| 216 | 7/31/2044 | $1,311.66 | $735.24 | $576.42 | $143,369.74 |
| 217 | 8/31/2044 | $1,311.66 | $738.18 | $573.48 | $142,631.56 |
| 218 | 9/30/2044 | $1,311.66 | $741.13 | $570.53 | $141,890.43 |
| 219 | 10/31/2044 | $1,311.66 | $744.10 | $567.56 | $141,146.33 |
| 220 | 11/30/2044 | $1,311.66 | $747.07 | $564.59 | $140,399.26 |
| 221 | 12/31/2044 | $1,311.66 | $750.06 | $561.60 | $139,649.20 |
| Year 2044 | $15,739.92 | $8,806.11 | $6,933.81 | $139,649.20 | |
| 222 | 1/31/2045 | $1,311.66 | $753.06 | $558.60 | $138,896.14 |
| 223 | 2/28/2045 | $1,311.66 | $756.08 | $555.58 | $138,140.06 |
| 224 | 3/31/2045 | $1,311.66 | $759.10 | $552.56 | $137,380.96 |
| 225 | 4/30/2045 | $1,311.66 | $762.14 | $549.52 | $136,618.82 |
| 226 | 5/31/2045 | $1,311.66 | $765.18 | $546.48 | $135,853.64 |
| 227 | 6/30/2045 | $1,311.66 | $768.25 | $543.41 | $135,085.39 |
| 228 | 7/31/2045 | $1,311.66 | $771.32 | $540.34 | $134,314.07 |
| 229 | 8/31/2045 | $1,311.66 | $774.40 | $537.26 | $133,539.67 |
| 230 | 9/30/2045 | $1,311.66 | $777.50 | $534.16 | $132,762.17 |
| 231 | 10/31/2045 | $1,311.66 | $780.61 | $531.05 | $131,981.56 |
| 232 | 11/30/2045 | $1,311.66 | $783.73 | $527.93 | $131,197.83 |
| 233 | 12/31/2045 | $1,311.66 | $786.87 | $524.79 | $130,410.96 |
| Year 2045 | $15,739.92 | $9,238.24 | $6,501.68 | $130,410.96 | |
| 234 | 1/31/2046 | $1,311.66 | $790.02 | $521.64 | $129,620.94 |
| 235 | 2/28/2046 | $1,311.66 | $793.18 | $518.48 | $128,827.76 |
| 236 | 3/31/2046 | $1,311.66 | $796.35 | $515.31 | $128,031.41 |
| 237 | 4/30/2046 | $1,311.66 | $799.53 | $512.13 | $127,231.88 |
| 238 | 5/31/2046 | $1,311.66 | $802.73 | $508.93 | $126,429.15 |
| 239 | 6/30/2046 | $1,311.66 | $805.94 | $505.72 | $125,623.21 |
| 240 | 7/31/2046 | $1,311.66 | $809.17 | $502.49 | $124,814.04 |
| 241 | 8/31/2046 | $1,311.66 | $812.40 | $499.26 | $124,001.64 |
| 242 | 9/30/2046 | $1,311.66 | $815.65 | $496.01 | $123,185.99 |
| 243 | 10/31/2046 | $1,311.66 | $818.92 | $492.74 | $122,367.07 |
| 244 | 11/30/2046 | $1,311.66 | $822.19 | $489.47 | $121,544.88 |
| 245 | 12/31/2046 | $1,311.66 | $825.48 | $486.18 | $120,719.40 |
| Year 2046 | $15,739.92 | $9,691.56 | $6,048.36 | $120,719.40 | |
| 246 | 1/31/2047 | $1,311.66 | $828.78 | $482.88 | $119,890.62 |
| 247 | 2/28/2047 | $1,311.66 | $832.10 | $479.56 | $119,058.52 |
| 248 | 3/31/2047 | $1,311.66 | $835.43 | $476.23 | $118,223.09 |
| 249 | 4/30/2047 | $1,311.66 | $838.77 | $472.89 | $117,384.32 |
| 250 | 5/31/2047 | $1,311.66 | $842.12 | $469.54 | $116,542.20 |
| 251 | 6/30/2047 | $1,311.66 | $845.49 | $466.17 | $115,696.71 |
| 252 | 7/31/2047 | $1,311.66 | $848.87 | $462.79 | $114,847.84 |
| 253 | 8/31/2047 | $1,311.66 | $852.27 | $459.39 | $113,995.57 |
| 254 | 9/30/2047 | $1,311.66 | $855.68 | $455.98 | $113,139.89 |
| 255 | 10/31/2047 | $1,311.66 | $859.10 | $452.56 | $112,280.79 |
| 256 | 11/30/2047 | $1,311.66 | $862.54 | $449.12 | $111,418.25 |
| 257 | 12/31/2047 | $1,311.66 | $865.99 | $445.67 | $110,552.26 |
| Year 2047 | $15,739.92 | $10,167.14 | $5,572.78 | $110,552.26 | |
| 258 | 1/31/2048 | $1,311.66 | $869.45 | $442.21 | $109,682.81 |
| 259 | 2/28/2048 | $1,311.66 | $872.93 | $438.73 | $108,809.88 |
| 260 | 3/31/2048 | $1,311.66 | $876.42 | $435.24 | $107,933.46 |
| 261 | 4/30/2048 | $1,311.66 | $879.93 | $431.73 | $107,053.53 |
| 262 | 5/31/2048 | $1,311.66 | $883.45 | $428.21 | $106,170.08 |
| 263 | 6/30/2048 | $1,311.66 | $886.98 | $424.68 | $105,283.10 |
| 264 | 7/31/2048 | $1,311.66 | $890.53 | $421.13 | $104,392.57 |
| 265 | 8/31/2048 | $1,311.66 | $894.09 | $417.57 | $103,498.48 |
| 266 | 9/30/2048 | $1,311.66 | $897.67 | $413.99 | $102,600.81 |
| 267 | 10/31/2048 | $1,311.66 | $901.26 | $410.40 | $101,699.55 |
| 268 | 11/30/2048 | $1,311.66 | $904.86 | $406.80 | $100,794.69 |
| 269 | 12/31/2048 | $1,311.66 | $908.48 | $403.18 | $99,886.21 |
| Year 2048 | $15,739.92 | $10,666.05 | $5,073.87 | $99,886.21 | |
| 270 | 1/31/2049 | $1,311.66 | $912.12 | $399.54 | $98,974.09 |
| 271 | 2/28/2049 | $1,311.66 | $915.76 | $395.90 | $98,058.33 |
| 272 | 3/31/2049 | $1,311.66 | $919.43 | $392.23 | $97,138.90 |
| 273 | 4/30/2049 | $1,311.66 | $923.10 | $388.56 | $96,215.80 |
| 274 | 5/31/2049 | $1,311.66 | $926.80 | $384.86 | $95,289.00 |
| 275 | 6/30/2049 | $1,311.66 | $930.50 | $381.16 | $94,358.50 |
| 276 | 7/31/2049 | $1,311.66 | $934.23 | $377.43 | $93,424.27 |
| 277 | 8/31/2049 | $1,311.66 | $937.96 | $373.70 | $92,486.31 |
| 278 | 9/30/2049 | $1,311.66 | $941.71 | $369.95 | $91,544.60 |
| 279 | 10/31/2049 | $1,311.66 | $945.48 | $366.18 | $90,599.12 |
| 280 | 11/30/2049 | $1,311.66 | $949.26 | $362.40 | $89,649.86 |
| 281 | 12/31/2049 | $1,311.66 | $953.06 | $358.60 | $88,696.80 |
| Year 2049 | $15,739.92 | $11,189.41 | $4,550.51 | $88,696.80 | |
| 282 | 1/31/2050 | $1,311.66 | $956.87 | $354.79 | $87,739.93 |
| 283 | 2/28/2050 | $1,311.66 | $960.70 | $350.96 | $86,779.23 |
| 284 | 3/31/2050 | $1,311.66 | $964.54 | $347.12 | $85,814.69 |
| 285 | 4/30/2050 | $1,311.66 | $968.40 | $343.26 | $84,846.29 |
| 286 | 5/31/2050 | $1,311.66 | $972.27 | $339.39 | $83,874.02 |
| 287 | 6/30/2050 | $1,311.66 | $976.16 | $335.50 | $82,897.86 |
| 288 | 7/31/2050 | $1,311.66 | $980.07 | $331.59 | $81,917.79 |
| 289 | 8/31/2050 | $1,311.66 | $983.99 | $327.67 | $80,933.80 |
| 290 | 9/30/2050 | $1,311.66 | $987.92 | $323.74 | $79,945.88 |
| 291 | 10/31/2050 | $1,311.66 | $991.88 | $319.78 | $78,954.00 |
| 292 | 11/30/2050 | $1,311.66 | $995.84 | $315.82 | $77,958.16 |
| 293 | 12/31/2050 | $1,311.66 | $999.83 | $311.83 | $76,958.33 |
| Year 2050 | $15,739.92 | $11,738.47 | $4,001.45 | $76,958.33 | |
| 294 | 1/31/2051 | $1,311.66 | $1,003.83 | $307.83 | $75,954.50 |
| 295 | 2/28/2051 | $1,311.66 | $1,007.84 | $303.82 | $74,946.66 |
| 296 | 3/31/2051 | $1,311.66 | $1,011.87 | $299.79 | $73,934.79 |
| 297 | 4/30/2051 | $1,311.66 | $1,015.92 | $295.74 | $72,918.87 |
| 298 | 5/31/2051 | $1,311.66 | $1,019.98 | $291.68 | $71,898.89 |
| 299 | 6/30/2051 | $1,311.66 | $1,024.06 | $287.60 | $70,874.83 |
| 300 | 7/31/2051 | $1,311.66 | $1,028.16 | $283.50 | $69,846.67 |
| 301 | 8/31/2051 | $1,311.66 | $1,032.27 | $279.39 | $68,814.40 |
| 302 | 9/30/2051 | $1,311.66 | $1,036.40 | $275.26 | $67,778.00 |
| 303 | 10/31/2051 | $1,311.66 | $1,040.55 | $271.11 | $66,737.45 |
| 304 | 11/30/2051 | $1,311.66 | $1,044.71 | $266.95 | $65,692.74 |
| 305 | 12/31/2051 | $1,311.66 | $1,048.89 | $262.77 | $64,643.85 |
| Year 2051 | $15,739.92 | $12,314.48 | $3,425.44 | $64,643.85 | |
| 306 | 1/31/2052 | $1,311.66 | $1,053.08 | $258.58 | $63,590.77 |
| 307 | 2/28/2052 | $1,311.66 | $1,057.30 | $254.36 | $62,533.47 |
| 308 | 3/31/2052 | $1,311.66 | $1,061.53 | $250.13 | $61,471.94 |
| 309 | 4/30/2052 | $1,311.66 | $1,065.77 | $245.89 | $60,406.17 |
| 310 | 5/31/2052 | $1,311.66 | $1,070.04 | $241.62 | $59,336.13 |
| 311 | 6/30/2052 | $1,311.66 | $1,074.32 | $237.34 | $58,261.81 |
| 312 | 7/31/2052 | $1,311.66 | $1,078.61 | $233.05 | $57,183.20 |
| 313 | 8/31/2052 | $1,311.66 | $1,082.93 | $228.73 | $56,100.27 |
| 314 | 9/30/2052 | $1,311.66 | $1,087.26 | $224.40 | $55,013.01 |
| 315 | 10/31/2052 | $1,311.66 | $1,091.61 | $220.05 | $53,921.40 |
| 316 | 11/30/2052 | $1,311.66 | $1,095.97 | $215.69 | $52,825.43 |
| 317 | 12/31/2052 | $1,311.66 | $1,100.36 | $211.30 | $51,725.07 |
| Year 2052 | $15,739.92 | $12,918.78 | $2,821.14 | $51,725.07 | |
| 318 | 1/31/2053 | $1,311.66 | $1,104.76 | $206.90 | $50,620.31 |
| 319 | 2/28/2053 | $1,311.66 | $1,109.18 | $202.48 | $49,511.13 |
| 320 | 3/31/2053 | $1,311.66 | $1,113.62 | $198.04 | $48,397.51 |
| 321 | 4/30/2053 | $1,311.66 | $1,118.07 | $193.59 | $47,279.44 |
| 322 | 5/31/2053 | $1,311.66 | $1,122.54 | $189.12 | $46,156.90 |
| 323 | 6/30/2053 | $1,311.66 | $1,127.03 | $184.63 | $45,029.87 |
| 324 | 7/31/2053 | $1,311.66 | $1,131.54 | $180.12 | $43,898.33 |
| 325 | 8/31/2053 | $1,311.66 | $1,136.07 | $175.59 | $42,762.26 |
| 326 | 9/30/2053 | $1,311.66 | $1,140.61 | $171.05 | $41,621.65 |
| 327 | 10/31/2053 | $1,311.66 | $1,145.17 | $166.49 | $40,476.48 |
| 328 | 11/30/2053 | $1,311.66 | $1,149.75 | $161.91 | $39,326.73 |
| 329 | 12/31/2053 | $1,311.66 | $1,154.35 | $157.31 | $38,172.38 |
| Year 2053 | $15,739.92 | $13,552.69 | $2,187.23 | $38,172.38 | |
| 330 | 1/31/2054 | $1,311.66 | $1,158.97 | $152.69 | $37,013.41 |
| 331 | 2/28/2054 | $1,311.66 | $1,163.61 | $148.05 | $35,849.80 |
| 332 | 3/31/2054 | $1,311.66 | $1,168.26 | $143.40 | $34,681.54 |
| 333 | 4/30/2054 | $1,311.66 | $1,172.93 | $138.73 | $33,508.61 |
| 334 | 5/31/2054 | $1,311.66 | $1,177.63 | $134.03 | $32,330.98 |
| 335 | 6/30/2054 | $1,311.66 | $1,182.34 | $129.32 | $31,148.64 |
| 336 | 7/31/2054 | $1,311.66 | $1,187.07 | $124.59 | $29,961.57 |
| 337 | 8/31/2054 | $1,311.66 | $1,191.81 | $119.85 | $28,769.76 |
| 338 | 9/30/2054 | $1,311.66 | $1,196.58 | $115.08 | $27,573.18 |
| 339 | 10/31/2054 | $1,311.66 | $1,201.37 | $110.29 | $26,371.81 |
| 340 | 11/30/2054 | $1,311.66 | $1,206.17 | $105.49 | $25,165.64 |
| 341 | 12/31/2054 | $1,311.66 | $1,211.00 | $100.66 | $23,954.64 |
| Year 2054 | $15,739.92 | $14,217.74 | $1,522.18 | $23,954.64 | |
| 342 | 1/31/2055 | $1,311.66 | $1,215.84 | $95.82 | $22,738.80 |
| 343 | 2/28/2055 | $1,311.66 | $1,220.70 | $90.96 | $21,518.10 |
| 344 | 3/31/2055 | $1,311.66 | $1,225.59 | $86.07 | $20,292.51 |
| 345 | 4/30/2055 | $1,311.66 | $1,230.49 | $81.17 | $19,062.02 |
| 346 | 5/31/2055 | $1,311.66 | $1,235.41 | $76.25 | $17,826.61 |
| 347 | 6/30/2055 | $1,311.66 | $1,240.35 | $71.31 | $16,586.26 |
| 348 | 7/31/2055 | $1,311.66 | $1,245.31 | $66.35 | $15,340.95 |
| 349 | 8/31/2055 | $1,311.66 | $1,250.30 | $61.36 | $14,090.65 |
| 350 | 9/30/2055 | $1,311.66 | $1,255.30 | $56.36 | $12,835.35 |
| 351 | 10/31/2055 | $1,311.66 | $1,260.32 | $51.34 | $11,575.03 |
| 352 | 11/30/2055 | $1,311.66 | $1,265.36 | $46.30 | $10,309.67 |
| 353 | 12/31/2055 | $1,311.66 | $1,270.42 | $41.24 | $9,039.25 |
| Year 2055 | $15,739.92 | $14,915.39 | $824.53 | $9,039.25 | |
| 354 | 1/31/2056 | $1,311.66 | $1,275.50 | $36.16 | $7,763.75 |
| 355 | 2/28/2056 | $1,311.66 | $1,280.60 | $31.06 | $6,483.15 |
| 356 | 3/31/2056 | $1,311.66 | $1,285.73 | $25.93 | $5,197.42 |
| 357 | 4/30/2056 | $1,311.66 | $1,290.87 | $20.79 | $3,906.55 |
| 358 | 5/31/2056 | $1,311.66 | $1,296.03 | $15.63 | $2,610.52 |
| 359 | 6/30/2056 | $1,311.66 | $1,301.22 | $10.44 | $1,309.30 |
| 360 | 7/31/2056 | $1,314.54 | $1,309.30 | $5.24 | $0.00 |
| Year 2056 | $9,184.50 | $9,039.25 | $145.25 | $0.00 |
To Sum It All Up
A 30-year fixed mortgage is the most accessible financing tool for many homebuyers. It comes with low monthly payments and is easier to qualify for compared to short-term loans. The government offers federally-backed mortgages with low downpayments (or zero downpayments) to aid low to moderate income borrowers. This helps you secure a home especially if you’re a first-time homebuyer.
However, it comes with several disadvantages. The long payment term generates large interest costs. And because payments are spread out for 30 years, interest rates for 30-year mortgages are also higher compared to shorter terms. Plus, you might be paying it well into your retirement.
Homeowners can shorten their payment term by making extra payments toward the principal. This reduces interest costs and can remove a few years off your loan. Meanwhile, if you qualify for refinancing, it’s a good idea to refinance to a lower rate with a shorter term. Either way, these methods will help you save more in the long run.