 Auto Loan Amortization Calculator
The Basics
When you change any input this calculator will automatically compute a loan's payment amount based on the principal amount borrowed, the length of the loan and the annual interest rate. Click on the "Create Amortization Schedule" button to create an amortization report you can print out.
Use for Any Loan Type
While this calculator was originally designed for vehicle loans, you can use it for any type of loan. For personal loans set the downpayment to $0. If you wanted to use this calculator for home mortgages, please keep in mind the amortization tables & payment amounts will only reflect the principal and interest on the loan. Other expenses like PMI, homeowner's insurance, HOA fees and property taxes are not included so as to not confuse anyone who came to this page specifically seeking an automotive amortization calculator.
Depreciation vs Appreciation
You can optionally enter depreciation information to estimate how much a vehicle might be worth at the end of a loan term. For a home - or another asset type that is likely to appreciate rather than depreciate - you can enter a negative number for the rate of depreciation to estimate how much it will appreciate over time. For example, if you thought a home was likely to appreciate at about 5% per year you would enter -5 in the depreciation fields.
Full Cost of Ownership
While this calculator allows people to estimate the cost of interest and depreciation, other costs of vehicle ownership like licensing, fueling, repairs & automotive insurance are not included. As a good rule of thumb repairs tend to run close to $100 or so per month on average, though it can vary significantly based on the vehicle's age and how it is driven.
Current Auto Loan Rates
We publish current auto loan rates for new & used vehicles. Car buyers can use these quotes to estimate competitive loan rates before dealing with an auto dealership in a negotation where the dealer has the upper hand and charges too high of an interest rate or tries to require unneeded extended warrany programs as a condition for extending funding.
The Auto Buyer’s Guide to Vehicle Finance and Depreciation
Originally published: December 3, 2013
Last updated: August 22, 2019
When they are secured using credit, the total purchase prices of big-ticket items are repaid over time, with interest added. Payment amounts and the duration of each billing cycle are unique to each loan, tied to a host of variables impacting repayment.
Major purchases, like real estate and cars, are financed using installment credit, which furnishes consistent repayment schedules and amounts. These purchases are long-term investments, requiring years to pay-off, so installment credit allows borrowers to forecast payment responsibilities accurately. Car loan amortization calculator harnesses all the factors influencing borrowing and repaying car loans, distilling your loan's payment amount at various intervals.
Financing Your Next Vehicle Purchase
With the prices of just about everything going up, more and more people are now opting for auto loans instead of paying up directly with cold cash. In fact, Experian's 2019 State of the Automotive Finance Market Report shows that 85% of new car buyers and 54% of used car buyers in the US market are taking out loans for car purchases.
However, the process of getting a car loan can be very complicated. But if you gather all of the necessary documents beforehand and review the loan process thoroughly, then you just might seal a good car loan deal for yourself.
Should I engage in dealer financing or apply for a bank loan instead?
Once you're sure that you're ready to apply for an auto loan, one of the first things that need to be settled is whether you should opt for direct dealer financing or go for a bank loan.
Bank loans and dealer financing are basically the same, but with dealer financing, the car dealer does all of the paperwork and the bank loan application on behalf of the buyer.
This is also why it is hard to tell which of these two options have lower interest rates as they are practically the same save for the presence of a third-party car dealer.
At the surface level of things, getting a car dealer to do all of the paperwork on your behalf seems like the easiest way to go: You just have to show up, provide financing and go home with your new car – all in a day's work. But keep in mind that dealer rates are considerably higher compared to bank loan rates.
On the other hand, opting for a bank loan means that you won't have to worry about rising interest rates. And since there's no middle man, you can be sure that you will have better payment rates and terms.
But this doesn't mean that bank loans don't have a few disadvantages of its own. First, while dealer rates are indeed higher than bank loan rates, dealer financing rates are negotiable while bank loan rates are not. Banks also tend to make just a single offer as compared to dealers who shop your credit profile to other lenders.
What are the fastest and slowest-depreciating car types?
The top 3 fastest-depreciating car types include the following:
- Acura RLX (% Depreciation: 55.8%)
- Lincoln MKZ (% Depreciation: 55.6%)
- Mercedes Benz E-Class (% Depreciation: 55.4%)
Meanwhile, the following are the top 3 car types with the slowest depreciation rate:
- Subaru Impreza (First-year price difference: -3%)
- Jeep Wrangler Unlimited (First-year price difference: -7.1%)
- Mercedes G-Class (First-year price difference: -8%)
What is the average auto loan term length for both new and used cars?
Experian's State of the Automotive Finance Market 2019 states that the current average loan term length for new cars is at 69 months and 65 months for used cars.
This is mostly due to a significant increase in car prices coupled with more and more consumers opting for high-end SUVs. At first glance, longer loan terms seem like an effective way to afford monthly payments of high-cost vehicles. However, low car payments with longer loan periods are not always the best choice since this means heftier payments for a much longer period.
Average Loan Rates for New & Used Vehicles by Loan Term
Based on the graph above, we can see that the interest rates for auto loans are affected by loan term lengths, especially for used cars. This is because used vehicles naturally have a higher risk than new ones since there is a bigger potential of car failure for used vehicles. In fact, some banks do not allow loan terms longer than 48-60 months for used cars since the value of vehicles depreciates over time.
How does credit score affect auto loan interest rates?
Loan applicants with excellent credit scores (720 and up) can enjoy interest rates that can go as low as 3.60%, while applicants who are still working on improving their credit profiles will have to make do with higher interest rates.
Credit scores have a direct impact on the amount of interest rate you will have to pay along with your auto loan repayments since credit profiles are an indicator of just how risky it is to lend money to applicants. The lower your credit score is, the riskier your profile, the higher your interest rate.
Credit conditions change over time, but the following table shows recently available rates on a 60-month new car loan.
| Fico Score | Car Loan APR % |
|---|---|
| 720 - 850 | 3.60% |
| 690 - 719 | 4.95% |
| 660 - 689 | 7.02% |
| 620 - 659 | 9.72% |
| 590 - 619 | 14.06% |
| 500 - 589 | 15.24% |
What is underwater equity and how can I avoid it?
Underwater equity or “upside-down” equity simply means that you currently owe more than your car's actual cash value.
This situation happens more often than we think, and while there are definitely solutions to get your loan to float above water, affected individuals can only either continue making payments and possibly lose their equity or just straight up sell their vehicle and face significant financial loss.
Luckily, there are ways you can steer clear of underwater equity in the future. This includes the following:
- Don't be tempted by zero downpayment offers
- Put in a large downpayment amount
- Consider buying a secondhand vehicle instead of a brand new one
Don't be tempted by zero downpayment offers
Zero downpayment car loan offers are usually offered to applicants with high credit scores. So if you're aware that your credit score is anything but impressive and you get a zero down offer, steer clear of this since this could lead you to an underwater car loan in the future.
Put in a large downpayment amount
The most ideal downpayment percentage that you should put in in order to secure yourself from going underwater is at least 20% of the car's total value.
Apart from a sizable downpayment, it is also best if applicants cover all additional fees on tax, titles, and licenses instead of letting these be covered by the loan. Moreover, applicants with poor credit scores can take advantage of high downpayment as this can help make up for high interest rates.
Consider buying a secondhand vehicle instead of a brand new one
Opting for a used car instead of a new one can lower the chances of you getting stuck in an underwater loan. This is because used cars have already lost about 20% of their initial value during their first year of usage, and this depreciated value plus a significant downpayment will help secure you against going underwater.
How much of new vehicle purchases come with an underwater trade-in?
In 2018, new car purchases amounted to 86%, with 43.5% going for a trade-in and about a third of these trade-ins going underwater. The car loan market also grew significantly in the last year despite auto purchases getting contracted. A lot of financial institutions cut borrowers with poor credit some slack just so they can remain on track with their revenue goals.
What is Buy Here Pay Here (BHPH) financing and why should I avoid it?
People with bad credit scores who want to get their car loans approved think that Buy Here, Pay Here schemes from car dealerships are their last resort. While this is somewhat true, this also comes at a hefty price which may not be worth it in the future.
Car dealerships offer BHPH schemes by acting as both lender and seller via in-house financing. Basically, cars get sold straight off of these dealers' lots, and even those with poor credit history can get approved as they have no regard for credit scores.
But BHPH schemes have average interest rates of at least 20% which is significantly higher than interest rates from online lenders and banks. So you will probably have to make do with hefty repayments in the future. This does not yet include hidden fees and charges that may come with the said scheme.
You'll also end up paying more than what your car is actually worth due to high interest rates and fees. This can put you underwater almost immediately.
Lastly, you'll also risk not being able to improve your credit score despite paying your dues on-time since some dealers that have BHPH schemes are notorious for not reporting payment history to the corresponding consumer credit bureaus.
How can I improve my credit rating and eventually lower my charged interest rates?
Improving your current credit score will definitely take a lot of work especially if you're starting off from a very poor rating, but this can be done. But the possibility of your interest rates going lower depends on whether your interest rates are simple or precomputed.
Simple interest loans are much more likely to decrease their interest rates over time especially if the borrower pays more than the required amount within a given period. Going over the needed amount decreases not only the loan's total balance but also the interest rates as well.
Precomputed interest loans are not as forgiving since loan amounts are already calculated in advance. This can make it difficult to pay off outstanding loans since overpayments will not affect your loan's current interest rate.
Here's how you can improve your credit score:
First off, make sure that you fulfill all of your payments on time, interest payments included. Failing to do so will only lower your credit score and this will not bode well if you're aiming to negotiate for a lower interest rate.
It is also best if you refrain from incurring any more additional debt while you are still repaying your auto loans since multiple debts will never look good for your credit rating.
Car loan refinancing vs. Mortgage refinancing
It is generally much easier to refinance a car loan than a mortgage since there are no fees that accompany early auto loan payments nor loan closing costs. This means that refinancing a vehicle will have little to no effect on your current balance. Mortgage refinancing comes with a lot of out-of-pocket payments and significant upfront closing costs. If a mortgage is advertised as having "no closing costs" it means those costs are either embedded directly in the loan amount or through charging a higher rate of interest.
If you simply want to put yourself in a better financial position while also improving your credit, then it is best to opt for a vehicle refinance as this is the fastest way for you to decrease your outstanding balances.
How long should I keep my brand new car before I can trade it in?
The general rule of thumb for new cars bought via an auto loan is that owners should ideally wait until their vehicle gains enough equity before trading it in. However, this will also depend on the terms and conditions laid out by your lender.
There are several factors that can affect whether your new car is already fit for a trade-in or otherwise. This includes things like your car's cash value, equity and of course, depreciation.
Of these three things, depreciation is the most influential since your vehicle starts depreciating the moment you drive it off your dealer's lot. Brand new vehicles also experience the biggest depreciation rates during their first year of use.
This is why new car owners are generally advised to wait until around their car's third year of use before it can be fit for a trade-in since depreciation rates will start leveling off at around this period.
When is the best time to buy a used car in terms of depreciation?
Newly-bought cars experience a significant amount of depreciation during its first year of use, with depreciation rates typically tapering off at around the third year.
Around the car's fourth year of use, however, its rate of depreciation starts rising again coupled with major additional costs stemming from repairs and maintenance. Most warranty services also lose their effect after the four-year mark.
So when is the most ideal period to buy a used car, depreciation-wise? Vehicles that are around 2-3 years old will give you the best value for your money since you get to avoid steep depreciation rates that come around shortly after purchase while also avoiding the expensive repairs that are associated with older vehicles.
In addition, you pay for only 60% to 70% of the total cost of a brand new car for a vehicle that's still very reliable and still covered by warranty.
Car loans can be very tricky to navigate, but armed with the right knowledge, you can definitely pull off a car loan approval and get your dream car in no time at all.
Leasing vs buying
Car shoppers may want to consider leasing if they have a routine but long commute to work & want to regularly change vehicles to ensure reliability, but changing cars frequently leads to significant depreciation expense.
When a vehicle is leased the depreciation of the vehicle is factored into the lease price. Thus if one decides to lease it is typically best to lease a vehicle which depreciates slowly.
Buying a car is typically cheaper than leasing one since there are fewer transactions involved & the person using the car maintains ownership over it. And if you own a vehicle outright and get into an accident the car can still run while being less than perfect from a cosmetic standpoint.
Amortizing Loans Reduces Lender Risk

Loan repayment is subject to terms and conditions agreed upon by lenders and borrowers as loans originate. The amount of each payment, the length of the repayment term, and the interest percentage applied to the loan represent the basis for car loan repayment schedules, which consumers use to budget for future purchases.
Loans are structured in different ways, each carrying distinct advantages for lenders and debtors. Balloon loans, for example, require interest only payments for a particular term, before the entire loan principal balance comes due. Because a large part of the financing comes due all at once, toward the end of a loan period, balloon or bullet loans are very risky to lenders. It is just too easy for borrowers to limp along with interest payments, only to falter when the mother lode comes due.
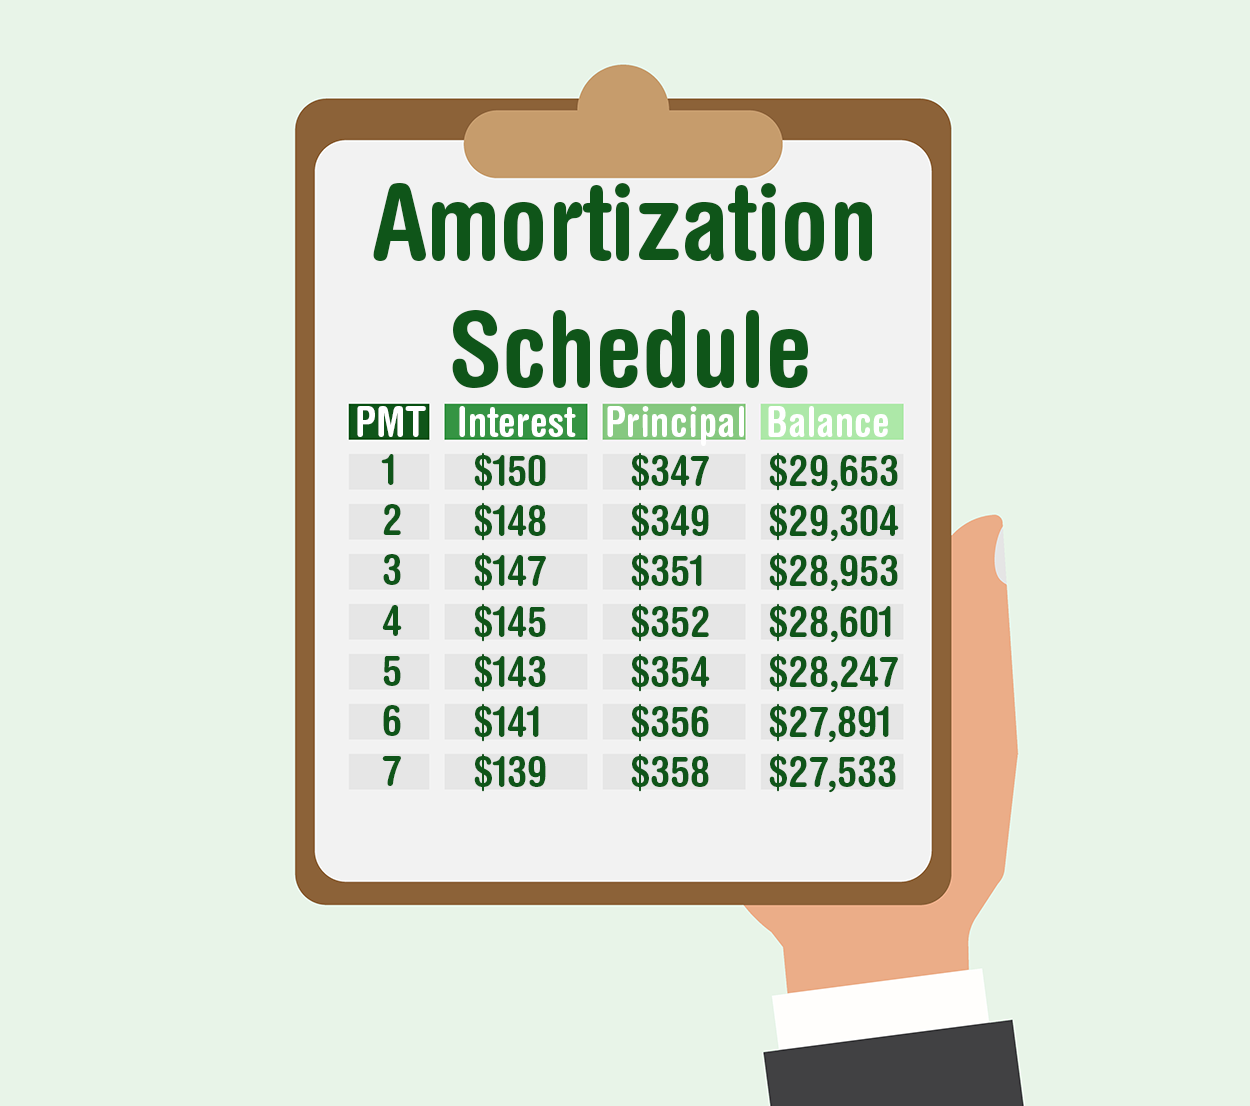
To limit risk and help borrowers budget for payments; mortgages, car financing, and other high-dollar loans are amortized, or spread out, over the course of long-term repayment. Amortized payments are associated with the original sum borrowed, or principal amount. The amount to be repaid is broken into manageable chunks, due each billing period. Interest is then added to each amortized principle payment, comprising the total required payment for each billing period.
Interest and amortized principal operate on different schedules, so additional measures are required to keep payment amounts balanced over the life of a loan. Early payments on mortgages and other installment credit, for example, include higher portions of interest than those falling closer to the end of a loan's life. As the final payments near, the amount of each payment applied to the original principal balance grows, while the interest amount charged during each billing cycle declines. Payments remain the same, they are just split-up differently.
Car amortization schedule uses inputs like down payment amount, loan term, and interest rate to help identify exactly what your car payments are, or will be. Interest is expressed as an annual percentage rate (APR) to be applied to the original loan balance. By keeping other terms equal, it is easy to see how APR influences each month's payment. Amortization calculations also use the type of payments you make to determine where you stand on car loan amortization. Monthly payments, for example, provide one set of payment obligations, while bi-weekly payments alter the structure of repayment schedules significantly.
Once created, amortization schedules hold true until one or more of the variables used to create them changes.
Example Amortization Schedule
Here is an example amortization schedule for a loan with the following characteristics:
- Loan Amount: $27,000.00
- Interest Rate: 4.00%
- Payment Interval: Monthly
- Loan Term: 6 Years
- Sales Tax: 0
- Down Payment: 0
- Trade-in: 0
This table is for reference only, please use the above calculator to create a printable version of your loan's amortization schedule.
| Payment | Amount | Principal | Interest | Balance |
| 1 | $422.42 | $332.42 | $90.00 | $26,667.58 |
| 2 | $422.42 | $333.53 | $88.89 | $26,334.05 |
| 3 | $422.42 | $334.64 | $87.78 | $25,999.41 |
| 4 | $422.42 | $335.76 | $86.66 | $25,663.65 |
| 5 | $422.42 | $336.87 | $85.55 | $25,326.78 |
| 6 | $422.42 | $338.00 | $84.42 | $24,988.78 |
| 7 | $422.42 | $339.12 | $83.30 | $24,649.66 |
| 8 | $422.42 | $340.25 | $82.17 | $24,309.41 |
| 9 | $422.42 | $341.39 | $81.03 | $23,968.02 |
| 10 | $422.42 | $342.53 | $79.89 | $23,625.49 |
| 11 | $422.42 | $343.67 | $78.75 | $23,281.82 |
| 12 | $422.42 | $344.81 | $77.61 | $22,937.01 |
| Year 1 | $5,069.04 | $4,062.99 | $1,006.05 | $22,937.01 |
| 13 | $422.42 | $345.96 | $76.46 | $22,591.05 |
| 14 | $422.42 | $347.12 | $75.30 | $22,243.93 |
| 15 | $422.42 | $348.27 | $74.15 | $21,895.66 |
| 16 | $422.42 | $349.43 | $72.99 | $21,546.23 |
| 17 | $422.42 | $350.60 | $71.82 | $21,195.63 |
| 18 | $422.42 | $351.77 | $70.65 | $20,843.86 |
| 19 | $422.42 | $352.94 | $69.48 | $20,490.92 |
| 20 | $422.42 | $354.12 | $68.30 | $20,136.80 |
| 21 | $422.42 | $355.30 | $67.12 | $19,781.50 |
| 22 | $422.42 | $356.48 | $65.94 | $19,425.02 |
| 23 | $422.42 | $357.67 | $64.75 | $19,067.35 |
| 24 | $422.42 | $358.86 | $63.56 | $18,708.49 |
| Year 2 | $5,069.04 | $4,228.52 | $840.52 | $18,708.49 |
| 25 | $422.42 | $360.06 | $62.36 | $18,348.43 |
| 26 | $422.42 | $361.26 | $61.16 | $17,987.17 |
| 27 | $422.42 | $362.46 | $59.96 | $17,624.71 |
| 28 | $422.42 | $363.67 | $58.75 | $17,261.04 |
| 29 | $422.42 | $364.88 | $57.54 | $16,896.16 |
| 30 | $422.42 | $366.10 | $56.32 | $16,530.06 |
| 31 | $422.42 | $367.32 | $55.10 | $16,162.74 |
| 32 | $422.42 | $368.54 | $53.88 | $15,794.20 |
| 33 | $422.42 | $369.77 | $52.65 | $15,424.43 |
| 34 | $422.42 | $371.01 | $51.41 | $15,053.42 |
| 35 | $422.42 | $372.24 | $50.18 | $14,681.18 |
| 36 | $422.42 | $373.48 | $48.94 | $14,307.70 |
| Year 3 | $5,069.04 | $4,400.79 | $668.25 | $14,307.70 |
| 37 | $422.42 | $374.73 | $47.69 | $13,932.97 |
| 38 | $422.42 | $375.98 | $46.44 | $13,556.99 |
| 39 | $422.42 | $377.23 | $45.19 | $13,179.76 |
| 40 | $422.42 | $378.49 | $43.93 | $12,801.27 |
| 41 | $422.42 | $379.75 | $42.67 | $12,421.52 |
| 42 | $422.42 | $381.01 | $41.41 | $12,040.51 |
| 43 | $422.42 | $382.28 | $40.14 | $11,658.23 |
| 44 | $422.42 | $383.56 | $38.86 | $11,274.67 |
| 45 | $422.42 | $384.84 | $37.58 | $10,889.83 |
| 46 | $422.42 | $386.12 | $36.30 | $10,503.71 |
| 47 | $422.42 | $387.41 | $35.01 | $10,116.30 |
| 48 | $422.42 | $388.70 | $33.72 | $9,727.60 |
| Year 4 | $5,069.04 | $4,580.10 | $488.94 | $9,727.60 |
| 49 | $422.42 | $389.99 | $32.43 | $9,337.61 |
| 50 | $422.42 | $391.29 | $31.13 | $8,946.32 |
| 51 | $422.42 | $392.60 | $29.82 | $8,553.72 |
| 52 | $422.42 | $393.91 | $28.51 | $8,159.81 |
| 53 | $422.42 | $395.22 | $27.20 | $7,764.59 |
| 54 | $422.42 | $396.54 | $25.88 | $7,368.05 |
| 55 | $422.42 | $397.86 | $24.56 | $6,970.19 |
| 56 | $422.42 | $399.19 | $23.23 | $6,571.00 |
| 57 | $422.42 | $400.52 | $21.90 | $6,170.48 |
| 58 | $422.42 | $401.85 | $20.57 | $5,768.63 |
| 59 | $422.42 | $403.19 | $19.23 | $5,365.44 |
| 60 | $422.42 | $404.54 | $17.88 | $4,960.90 |
| Year 5 | $5,069.04 | $4,766.70 | $302.34 | $4,960.90 |
| 61 | $422.42 | $405.88 | $16.54 | $4,555.02 |
| 62 | $422.42 | $407.24 | $15.18 | $4,147.78 |
| 63 | $422.42 | $408.59 | $13.83 | $3,739.19 |
| 64 | $422.42 | $409.96 | $12.46 | $3,329.23 |
| 65 | $422.42 | $411.32 | $11.10 | $2,917.91 |
| 66 | $422.42 | $412.69 | $9.73 | $2,505.22 |
| 67 | $422.42 | $414.07 | $8.35 | $2,091.15 |
| 68 | $422.42 | $415.45 | $6.97 | $1,675.70 |
| 69 | $422.42 | $416.83 | $5.59 | $1,258.87 |
| 70 | $422.42 | $418.22 | $4.20 | $840.65 |
| 71 | $422.42 | $419.62 | $2.80 | $421.03 |
| 72 | $422.43 | $421.03 | $1.40 | $0.00 |
| Year 6 | $5,069.05 | $4,960.90 | $108.15 | $0.00 |
| Grand Total | $30,414.25 | $27,000.00 | $3,414.25 |